EXIF/meta-data Linkage

Been sitting on these for a while (sigh).
Why do we care about meta-data (examining and/or purging)?
Well for starters “dere’s gold in dem dere hills!”
“Did you map all of the USB removable storage devices that had been connected to the system?  You don't need to have the management software installed to copy images and videos (hint, hint) off of a phone...just connect it via a USB cable and copy the images (which will likely have some very useful EXIF data available).”
In addition, there are a number of freeware (and $-$$$$) image viewers/tools that also include meta-data handling embedded in them. This post is focused on meta-data specific tools. I’ll post linkage on some of the other applications that are more in this later class soon.


轉自 http://grandstreamdreams.blogspot.com/2012/01/exifmeta-data-linkage.html

Active Directory Linkfest

I’m working hard at getting up to speed on the whole Microsoft Active Directory thing.
Until lately, I’ve not had either the need nor the opportunity to get heavily involved in supporting customers in a full-blow AD environment. Sure, there are some basic “foundational" things I’ve been able to pick up and use, but now we are moving forward into a brave new world and I gotta kick up my expertise a bit. I’ve already purchased and am working through this excellent Active Directory: Designing, Deploying, and Running Active Directory, Fourth Edition (Amazon.com link) book to get the ball rolling.
So expect a few more AD-related posts around here…at least on the front end they will be more resource linking related as I fill out my virtual bookshelf.
The 4sysops - For Windows Administrators website hosted by Michael Pietroforte is my go-to source for the best of tools and tips related to Windows system administration. It is full of great information and resources related to Active Directory items!
Expect more AD-related resource posts moving forward.
If you have any great and free AD-related tools, tips and resources please share in the comments!
Cheers!

轉自 http://grandstreamdreams.blogspot.com/2012/01/active-directory-linkfest.html

Dual Purpose Volatile Data Collection Script

When responding to a potential security incident a capability is needed to quickly triage the system to see what's going on. Is a rogue process running on the system, whose currently logged onto the system, what other systems are trying to connect over the network, or how do I document the actions I took on the system. These are valid questions during incident response whether the response is for an actual event or a simulation. One area to examine to get answers is the systems' volatile data. Automating the collection of volatile data can save valuable time which in turn helps analysts examine the data faster in order to get answers. This post briefly describes (and releases) the Tr3Secure volatile data collection script I wrote.

Tr3Secure needed a toolset for responding to systems during attack simulations and one of the tools had to quickly collect volatile data on a system (I previously discussed what Tr3Secure is here). However, the volatile data collection tool had to provide dual functions. First and foremost it had to properly preserve and acquire data from live systems. The toolset is initially being used in a training environment but the tools and processes we are learning need to be able to translate over to actual security incidents. What good is mastering a collection tool that can’t be used during live incident response activities? The second required function was the tool had to help with training people on examining volatile data. Tr3Secure members come from different information security backgrounds so not every member will be knowledgeable about volatile data. Collecting data is one thing but people will eventually need to know how to understand what the data means. The DFIR community has a few volatile data collection scripts but none of the scripts I found provided the dual functionality for practical and training usage. So I went ahead and wrote a script to meet our needs.


Practical Usage


These were some considerations taken into account to ensure the script is scalable to meet the needs for volatile data collection during actual incident response activities.

        Flexibility

Different responses will have different requirements on where to store the volatile data that’s collected. At times the data may be stored on the same drive where the DFIR toolset is located while at other times the data may be stored to a different drive. I took this into consideration and the volatile data collection script allows for the output data to be stored on a drive of choice. If someone prefers to run their tools from a CD-ROM while someone else works with a large USB removable drive then the script can be used by the both of them.

        Organize Output
 
Troy Larson posted a few lines of code from his collection script to the Win4n6 sometime ago. One thing I noticed about his script was that he organized the output data based on a case number. I incorporated his idea into my script; a case number needs to be entered when the script is run on a system. A case folder enables data collected from numerous systems to be stored in the same folder (folder is named Data-Case#). In addition to organizing data into a case folder, the actual volatile data is stored in a sub-folder named after the system the data came from (system's computer name is used to name the folder). To prevent overwriting data by running the script multiple times on the same system I incorporated a timestamp into the folder name (two digit month, day, year, hour, and minute). Appending a timestamp to the folder name means the script can execute against the same system numerous times and all of the volatile data is stored in separate folders. Lastly, the data collected from the system is stored in separate sub-folders for easier access. The screenshot below shows the data collected for Case Number 100 from the system OWNING-U on 01/01/2012 at 15:46.


        Documentation

Automating data collection means that documentation can be automated as well. The script documents everything in a collection log. Each case has one collection log so regardless if data is collected from one or ten systems an analyst will only have to worry about reviewing one log.


The following information is documented both to the screen for an analyst to see and a collection log file: case number, examiner name, target system, user account used to collect data, drives for tools and data storage, time skew, and program execution. The script prompts the analyst for the case number, their name, and the drive to store data on. This information is automatically stored in the collection log so the analyst doesn’t have to worry about maintaining documentation elsewhere. In addition, the script prompts the analyst for the current date and time which is used to record the time difference between the system and the actual time. Every program executed by the script is recorded in the collection log along with a timestamp of when the program executed. This will make it easier to account for artifacts left on a system if the system is examined after the script is executed. The screenshot below shows the part of the collection log for the data collected from the system OWNING-U.


        Preservation

RFC 3227’s Order of Volatility outlines that evidence should be collected starting with the most volatile then proceeding to the less volatile. The script takes into account the order of volatility during data collection. When all data is selected for collection, the memory is first imaged then volatile data is collected followed by collecting non-volatile data. The volatile data collected is: process information, network information, logged on users, open files, clipboard, and then system information. The non-volatile data collected is installed software, security settings, configured users/groups, system's devices, auto-runs locations, and applied group policies. Another item the script incorporated from Troy Larson’s comment in the Win4n6 group is preserving the prefetch files before volatile data is collected. I never thought about this before I read his comment but it makes sense. Volatile data gets collected by executing numerous programs on a system and these actions can overwrite the existing prefetch files with new information or files. Preserving the prefetch files upfront ensures analysts will have access to most of the prefetch files that were on the system before the collection occurred (four prefetch files may be overwritten before the script preserves them). The script uses robocopy to copy the prefetch files so the file system metadata (timestamps, NTFS permissions, and file ownership) is collected along with the files themselves. The screenshot below shows the preserved files for system OWNING-U.


        Tools Executed

The readme file accompanying the script outlines the various programs used to collect data. The programs include built-in Windows commands and third party utilities. The screenshot below shows the tools folder where the third party utilities are stored.


I’m not going to discuss every program but I at least wanted to highlight a few. Windows diskpart command allows for disks, partitions, and volumes to be managed through the command line. The script leverages diskpart to make it easy for an analyst to see what drives and volumes are attached to a system. Hopefully, the analyst won’t need to open up Windows explorer to see what the removable media drive mappings are since the script displays the information automatically as shown below. Note, to make diskpart work a text file needs to be created in the tools folder named diskpart_commands.txt and the file needs to contain these two commands on separate lines: list disk and list volume.


Mandiant’s Memoryze is used to obtain a forensic image of the system’s memory. Memoryze supports a wide range of Windows operating systems which makes the script more versatile for dumping RAM. The key reason the script uses Memoryze is because it’s the only free memory imaging program I found that allows an image to be stored in a folder of your choice. Most programs will place the memory image in the same folder where the command line is opened. This wouldn’t work because the image would be dropped in the folder where the script is located instead of the drive the analyst wants. Memoryze uses an xml configuration file to image RAM so I borrowed a few lines of code from the MemoryDD.bat batch file to create the xml file for the script. Note, the script only needs the memoryze.exe; to obtain the exe install Memoryze on a computer then just copy memoryze.exe to the Tools folder.

PXServer’s Winaudit program obtains the configuration information from a system and I first became acquainted with the program during my time performing vulnerability assessments. The script uses Winaudit to collect some non-volatile data including the installed software, configured users/groups, and computer devices. Winaudit is capable of collecting a lot more information so it wouldn’t be that hard to incorporate the additional information by modifying the script.


Training Usage


These were the two items put into the script to assist with training members on performing incident response system triage.

        Ordered Output Reports

The script collects a wealth of information about a system and this may be overwhelming to analysts new to examining volatile data. For example, the script produces six different reports about the processes running on a system. A common question when faced with so many reports is how should they be reviewed. The script’s output reports have numbers which is the suggested order for them to be reviewed. This provides a little assistance to analysts until they develop their own process for examining the data. The screenshots below shows the process reports in the output folder and those reports opened in Notepad ++.


        Understanding Tool Functionality and Volatile Data

The script needs to help people better understand what the collected data means about the system where it came from. Two great references for collecting, examining, and understanding volatile data are Windows Forensic Analysis, 2nd edition and Malware Forensics: Investigating and Analyzing Malicious Code. I used both books when researching and selecting the script’s tools to collect volatile data. What better ways to help someone better understand the tools or data then by directing them to references that explain it? I placed comments in the script containing the page number where a specific tool is discussed and the data explained in both books. The screenshot below shows the portion of the script that collects process information and the references are highlighted in red.


Releasing the Tr3Secure Volatile Data Collection Script


There are very few things I do forensically that I think are cool; this script happens to be one of them. There are not many tools or scripts that work as intended while at the same time provide training. People who have more knowledge about volatile data can hit the ground running with the script investigating systems. The script automates imaging memory image, collecting volatile/non-volatile data, and documenting every action taken on the system. People with less knowledge can leverage the tool to learn how to investigate systems. The script collects data then the ordered output and references in the comments can be used to interpret the data. Talk about killing two birds with one stone.


The following is the location to the zip file containing the script and the readme file <zip download link is here>. Please be advised, a few programs the script uses require administrative rights to run properly.


轉自 http://journeyintoir.blogspot.com/2012/01/dual-purpose-volatile-data-collection.html 

找出 Linux 是否有隱藏的 Process 與 Port - unhide

很多 rootkits 用了一些隱藏技巧,用 netstat 也找不出來,這個時候可以用 chkrootkit 這類工具掃瞄,另外還可以用 Unhide 搜索是否有不尋常的 process 及 port。
Unhide 是一個輕巧的安全工具,可以找出 rootkit 所開啟的 process 或 TCP/UDP ports,除了 Unix 版本外,它還有 Windows 版本。

如果是使用 Redhat,可以到 pkgs.org 下載相應版本的 rpm 檔案裝。
在 Debian / Ubuntu 則較簡單,用 apt-get 安裝就好了。

# apt-get install unhide
 
至於使用上也是很簡單,一般上以下幾個指令就會搜索系統內隱藏的 process 及 ports:

# unhide-posix proc
# unhide-posix sys
# unhide-tcp
 
轉自 http://www.hkcode.com/linux-bsd-notes/615

Jump List Analysis

I've recently spoke with a couple of analysts I know, and during the course of these conversations, I was somewhat taken aback by how little seems to be known or available with respect to Jump Lists.  Jump Lists are artifacts that are new to Windows 7 (...not new as of Vista...), and are also available in Windows 8.  This apparent lack of attention to Jump Lists is most likely due to the fact that many analysts simply haven't encountered Windows 7 systems, or that Jump Lists haven't played a significant role in their examinations.  I would suggest, however, that any examination that includes analysis of user activity on a system will likely see some significant benefit from understanding and analyzing Jump Lists.

I thought what I'd try do is consolidate some information on Jump Lists and analysis techniques in one location, rather than having it spread out all over.  I should also note that I have a section on Jump Lists in the upcoming book,
Windows Forensic Analysis 3/e, but keep in mind that one of the things about writing books is that once you're done, you have more time to conduct research...which means that the information in the book may not be nearly as comprehensive as what has been developed since I wrote that section.

In order to develop a better understanding of these artifacts, I wrote some code to parse these files.  This code consists of two Perl modules, one for parsing the basic structure of the *.automaticDestinations-ms Jump List files, and the other to parse LNK streams.  These modules not only provide a great deal of flexibility with respect to what data is parsed and how it can be displayed (TLN format, CSV, table, dumped into a SQLite database, etc.), but also the depth to which the data parsing can be performed.


Jump List Analysis

Jump Lists are located within the user profile, and come in two flavors; automatic and custom Jump Lists.  The automatic Jump Lists (*.automaticDestinations-ms files located in %UserProfile%\AppData\Roaming\Microsoft\Windows\Recent\AutomaticDestinations) are created automatically by the shell as the user engages with the system (launching applications, accessing files, etc.).  These files follow the MS-CFB compound file binary format, and each of the numbered streams within the file follows the MS-SHLLINK (i.e., LNK) binary format.

The custom Jump Lists (*.customDestinations-ms files located in
%UserProfile%\AppData\Roaming\Microsoft\Windows\Recent\CustomDestinations) are created when a user "pins" an item (see this video for an example of how to pin an item).  The *.customDestinations-ms files are apparently just a series of LNK format streams appended to each other.

Each of the Jump List file names starts with a long string of characters that is the application ID, or "AppID", that identifies the specific application (and in some cases, version) used to access specific files or resources.  There is a list of AppIDs on the
ForensicsWiki, as well as one on the ForensicArtifacts site.

From an analysis perspective, the existence of automatic Jump Lists is an indication of user activity on the system, and in particular interaction via the shell (Windows Explorer being the default shell).  This interaction can be via the keyboard/console, or via RDP.  Jump Lists have been found to persist after an application has been deleted, and can therefore provide an indication of the use of a particular application (and version of that application), well after the user has removed it from the system.  Jump Lists can also provide indications of access to specific files and resources (removable devices, network shares). 


Further, the binary structure of the automatic Jump Lists provides access to additional time stamp information.  For example, the structures for the compound binary file directory entries contain fields for creation and modification times for the storage object; while writing and testing code for parsing Jump Lists, I have only seen the creation dates populated.


Digging Deeper: LNK Analysis

Within the automatic Jump List files, all but one of the streams (i.e., the DestList stream) are comprised of LNK streams.  That's right...the various numbered streams are comprised of binary streams following the MS-SHLLINK binary format.  As such, you can either use something like MiTeC's SSV to view and extract the individual streams, and then use an LNK viewer to view the contents of each stream, or you can use Mark Woan's JumpLister to view and extract the contents of each stream (including the DestList stream).  The numbered streams do not have specific MAC times associated with them (beyond time stamps embedded in MS-CFB format structures), but they do contain MAC time stamps associated with the target file. 

Most any analyst who has done LNK file analysis is aware of the wealth of information contained in these files/streams.  My own testing has shown that various applications populate these streams with different contents.  One thing that's of interest...particularly since it was pointed out in Harry Parsonage's
The Meaning of LIFE paper...is that some LNK streams (I say "some" because I haven't seen all possible variations of Jump Lists yet, only a few...) contain ExtraData (defined in the binary specfication), including a TrackerDataBlock.  This structure contains a machineID (name of the system), as well as two "Droids", each of which consists a VolumeID GUID and a version 1 UUID (ObjectID).  These structures are used by the Link Tracking Service; the first applies to the new volume (where the target file resides now), and the second applies to the birth volume (where the target file was when the LNK stream was created).  As demonstrated in Harry's paper, this information can be used to determine if a file was moved or copied; however, this analysis is dependent upon the LNK stream being created prior to the action taking place.  The code that I wrote extracts and parses these values into their components, so that checks can be written to automatically determine if the target file was moved or copied.

There's something specific that I wanted to point out here that has to do with LNK and Jump List analysis.  The format specification for the ObjectID found in the TrackerDataBlock is based on UUID version 1, defined in
RFC 4122.  Parsing the second half of the "droid" should provide a node identifier in the last 6 bytes of stream.  Most analysts simply seem to think that this is the MAC address (or a MAC address) for the system on which the target file was found.  However, there is nothing that I've found thus far that states emphatically that it MUST be the MAC address; rather, all of the resources I've found indicate that this value can be a MAC address.  Given that a system's MAC address is not stored in the Registry by default, analysis of an acquired image makes this value difficult to verify.  As such, I think that it's very important to point out that while this value can be a MAC address, there is nothing to specifically and emphatically state that it must be a MAC address.

DestList Stream

The DestList stream is found only in the automatic Jump Lists, and does not follow the MS-SHLLINK binary format (go here to see the publicly documented structure of this stream).  Thanks to testing performed by Jimmy Weg, it appears that not only is the DestList stream a most-recently-used/most-frequently-used (MRU/MFU) list, but some applications (such as Windows Media Player) appear to be moving their MRU lists to Jump Lists, rather than continuing to use the Registry.  As such, the DestList streams can be a very valuable component of timeline analysis.

What this means is that the DestList stream can be parsed to see when a file was most recently accessed.  Unlike Prefetch files, Jump Lists do not appear (at this point) to contain a counter of how many times a particular file (MSWord document, AVI movie file, etc.) was accessed or viewed, but you may be able to determine previous times that a file was accessed by parsing the appropriate Jump List file found in Volume Shadow Copies. 


Summary

Organizations are moving away from Windows XP and performing enterprise-wide rollouts of Windows 7.  More and more, analysts will encounter Windows 7 (and before too long, Windows 8) systems, and need to be aware of the new artifacts available for analysis.  Jump Lists can hold a wealth of information, and understanding these artifacts can provide the analyst with a great deal of clarity and context.

Resources

ForensicsWiki: Jump Lists
Jump List Analysis pt. I, II, III
DestList stream structure documented
Harry Parsonage's The Meaning of LIFE paper - a MUST READ for anyone conducting LNK analysis
RFC 4122 - UUID description; sec 4.1.2 describes the structure format found in Harry's paper; section 4.1.6 describes how the Node field is populated
Perl UUID::Tiny module - Excellent source of information for parsing version 1 UUIDs 


轉自 http://windowsir.blogspot.com/2011/12/jump-list-analysis.html

How to Use Advanced Google Search Techniques to Resolve your Investigations

If you’re like me, you probably use Google many times a day. But, chances are, unless you are a technology geek, you probably still use Google in its simplest form. If your current use of Google is limited to typing a few words in, and changing your query until you find what you’re looking for, then I’m here to tell you that there’s a better way – and it’s not hard to learn. On the other hand, if you are a technology geek, and can use Google like the best of them already, then I suggest you bookmark this article of Google search tips. You’ll then have the tips on hand when you are ready to pull your hair out in frustration when watching a neophyte repeatedly type in basic queries in a desperate attempt to find something.
The following Google tips are based on my own experience and things that I actually find useful. The list is by no means comprehensive. But, I assure you that by learning and using the 12 tips below, you’ll rank up there with the best of the Google experts out there. I’ve kept the descriptions of the search tips intentionally terse as you’re likely to grasp most of these simply by looking at the example from Google anyways.

12 Expert Google Search Tips
  1. Explicit Phrase:
         Lets say you are looking for content about internet marketing. Instead of      just typing Bill Clinton into the Google search box, you will      likely be better off searching explicitly for the phrase. To do this,      simply enclose the search phrase within double quotes.
Example: "Bill Clinton"
  1. Exclude Words:
         Lets say you want to search for content about a certain phone number, but      you want to exclude any results that contain the term eBay. To do      this, simply use the "-" sign in front of the word you want to      exclude.
Example Search: 555-1212 -eBay
  1. Site Specific Search:
         Often, you want to search a specific website for content that matches a      certain phrase. Even if the site doesn’t support a built-in search      feature, you can use Google to search the site for your term. Simply use      the "site:somesite.com" modifier. This will allow you to search      the entire site for the given search term.
Example: "ipod 32gb touch" site:www.craigslist.org
Example: "Brittany Spears" site:www.facebook.com
  1. Similar Words and Synonyms:
         Let’s say you want to include a word in your search, but want to include      results that contain similar words or synonyms. To do this, use the      "~" in front of the word.
Example: "Apple Ipad 32gb" ~Ipod 32 gb
  1. Specific Document Types:
         If you’re looking to find results that are of a specific type, you can use      the modifier "filetype:". For example, you might want to find      only PowerPoint presentations related to internet marketing.
 Example: "internet marketing" filetype:ppt

  1. This OR That:
         By default, when you do a search, Google will include all the terms      specified in the search. If you are looking for any one of one or more      terms to match, then you can use the OR operator. (Note: The OR has to be      capitalized).
Example: internet marketing OR advertising
  1. Phone Listing:
         Let’s say someone calls you on your mobile number and you don’t know who      it is. If all you have is a phone number, you can look it up on Google      using the phonebook feature.
Example: phonebook:617-555-1212 (note: the provided number does not work – you’ll have to use a real number to get any results).
  1. Area Code Lookup:
         If all you need to do is to look-up the area code for a phone number, just      enter the 3-digit area code and Google will tell you where it’s from.
Example: 617
  1. Numeric Ranges:
         This is a rarely used, but highly useful tip. Let’s say you want to find      results that contain any of a range of numbers. You can do this by using      the X..Y modifier (in case this is hard to read, what’s between the X and      Y are two periods.) This type of search is useful for years (as shown      below), prices, or anywhere where you want to provide a series of numbers.     
Example: president 1940..1950
  1. Stock (Ticker Symbol):
         Just enter a valid ticker symbol as your search term and Google will give      you the current financials and a quick thumb-nail chart for the stock.
Example: GOOG
  1. Calculator:
         The next time you need to do a quick calculation, instead of bringing up      the Calculator applet, you can just type your expression in to Google.
Example: 48512 * 1.02
  1. Word Definitions:
         If you need to quickly look up the definition of a word or phrase, simply      use the "define:" command.
Example: define:plethora
Hope this list of Google search tips proves useful in your future Google searches. If there are any of your favorite Google expert power tips that I’ve missed, please feel free to share them in the comments. If you would like to learn more about using this powerful tool you can check out the Social Networking Investigations Webinar at the McAfee Institute.


轉自 http://www.mcafeenetwork.com/forum/topics/how-to-use-advanced-google-search-techniques-to-resolve-your-inve

Ripping Volume Shadow Copies Sneak Peek

I was hesitant to do a sneak peak about a different approach to examine Volume Shadow Copies (VSCs). I personally don’t like sneak peeks and would rather wait to see the finished product. I think it’s along the lines of starting a movie then stopping it after 15 minutes and being forced to finish watching months later. If I don’t like sneak peeks then why am I putting others through it? I previously mentioned how I wanted to spend my furlough days by putting together some posts about another approach to examining VSCs. Well last week was my furlough week and my family wrote a new version to the carol The Twelve Days of Christmas. Four out of town trips, three sick kids, two family emergencies, and one blogger quarantined to his room. Needless to say I had to spend my time focused on my family. I won’t have time to write the VSCs blog posts until next month so I at least wanted to show one example on how I use this method.

There are times when I get a system that has been altered and one change is removing financial software from the system. This is pretty important because if I’m trying to locate financial data then I need to know what software is on the system so I know what kind of files to look for. There is a chance some file types might initially be missed if I’m not aware a certain program was installed at some point in the past. Different registry keys can help determine what programs were installed or executed but you can get a more complete picture about a system by looking at those same registry keys at different points in time. Performing registry analysis in this manner has allowed me to quickly identify uninstalled financial applications which reduced the time needed to find the data. Anyone who has used Harlan’s RipXP understands the value in seeing registry keys at different points in time. I used the same concept with one exception: numerous registry keys can be queried at the same time when dealing with VSCs.


The system I used for this demonstration was a live Windows 7 Ultimate 32 bit system. In the past I also used it against Windows 7 and Vista. forensic images


Obtaining General Operating System Information


I discussed previously one initial examination step is to get a better understanding about the system I’m facing. I use a batch script with Regripper to obtain a wealth of information about how the system was configured when it was last powered on. The configuration information is from only one point in time but if the system has VSCs then that means the same information can be obtained from different points in time. Seeing the same configuration information enables you to see how the system changed slightly over time including what software was installed or uninstalled. To do this I made some modifications to the general operating system batch script which lets me run it against VSCs I have access to.


I’m not going to discuss accessing VSCs in this post. For information on how to access VSCs I’d check out Harlan’s Even More Stuff post since he provides a link to his slide deck he gave to the online DFIR meet-up on the topic. My Windows 7 system had 19 VSCs and for the demonstration I only used the following:

        - ShadowCopy19 12/13/2011 6:13:35 PM
        - ShadowCopy16 12/01/2011 8:08:50 AM
        - ShadowCopy3 11/28/2011 11:19:40 AM
        - ShadowCopy1 8/26/2011 12:15:34 PM

The screen shot below shows the main menu to the vsc-parser (most selections have sub menus). To review the system to identify software of interest I’m interested in selection 2: “Obtain General Operating System Information from Volume Shadow Copies”.


The selection will immediately execute my Regripper batch file against every VSC I have access to. The picture below shows the script running against my four VSCs. I highlighted the samparse and uninstall plug-ins that executed.


The output from the script is nicely organized into different folders based on what the information is.


I’m interested in the software on the system which means I need the reports in the software-information folder. A report was created for each VSC I had access to (notice how the file name contains the VSC number it came from).


Now at this point I can review the reports and notice the slight differences between each VSCs. I tend to look at the most recent VSC then work my way to the oldest VSC. It makes it easier to see how the system slightly changed over time from the forensic image I examined first.


On a case I used this technique and it helped me to identify a financial application that was removed from the system. In the end it saved some a lot of time because this was one of my initial steps and I knew right off the bat I was looking for specific file types. Some may be wondering why I decided to highlight the samparse plug-in as well. At another time the same technique helped me verify a user account existed on the system and narrow down the timeframe when it was removed from the system.

I showed an example running Regripper against registry hives stored in VSCs on a live Windows 7 system. However, the approach is not only limited to registry hives or Regripper since you can pretty much parse any data stored in a VSC. 


轉自 http://journeyintoir.blogspot.com/2011/12/ripping-volume-shadow-copies-sneak-peek.html 

Android邏輯數據手動提取和分析

Android邏輯數據手動提取和分析

1. SMS、MMS相關信息的手動提取
首先,通過鏡像或者具備ROOT權限的程序將以下文件夾完整提取:
image
以下分別對各個目錄進行解釋:
  • App_parts:
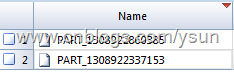
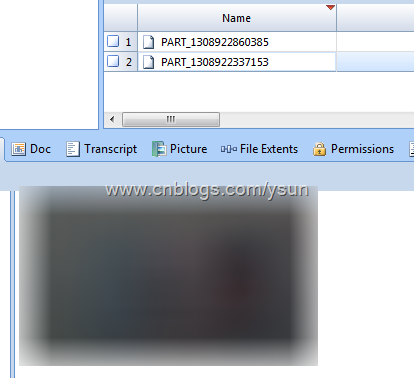
手機中收發的彩信附件,如圖片:
image
該文件是以附件添加/收到的時間命名的,時間戳採用毫秒換算,由於不熟悉C語言哭泣的脸,只能用Excel做一個換算式:
image
文件解析為圖片:
image
  • Databases
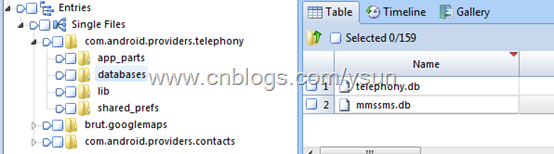
該文件夾下包含兩個文件:
image
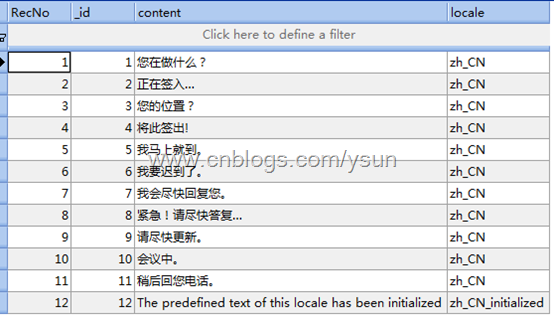
分別包含手機APN信息:
image
手機短信、彩信中包含的所有號碼信息(推薦號碼/典型號碼):
image
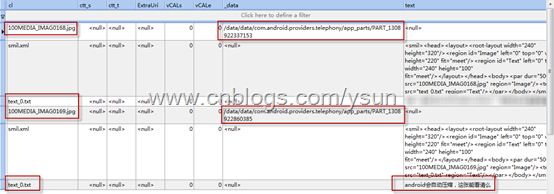
以保存(已發送/已接收)的彩信結構:
image
快速回覆短信:
image
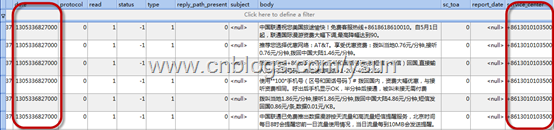
全部短信內容:
image
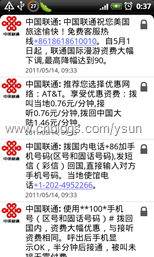
提取出的數據經時間戳轉化後與原信息無異。
imageimage
2. 通訊錄手動提取和解析
手機中設置同步的Gmail帳戶:
image
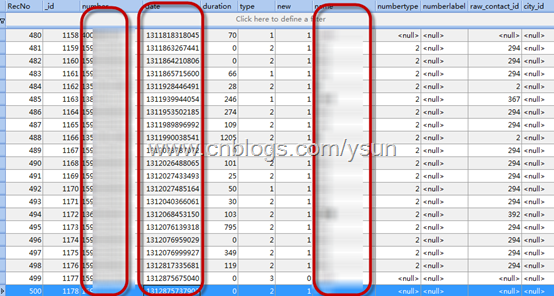
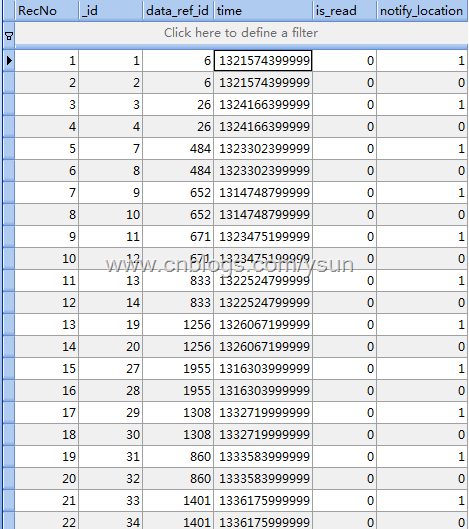
最近500條通話記錄:
image
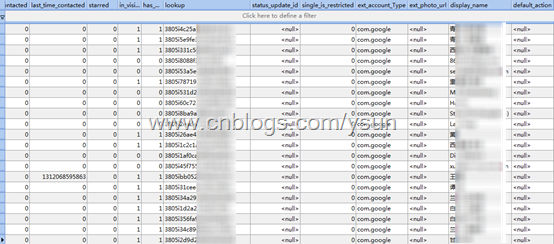
所有聯繫人:
image
所有事件(如聯繫人生日)保存信息:
image
聯繫人分組:
image
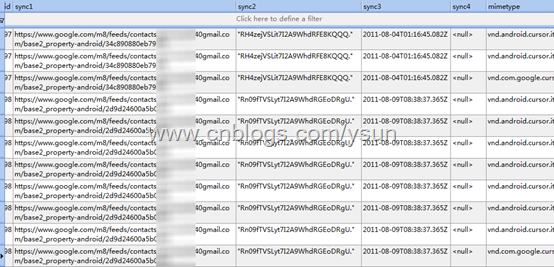
所有聯繫人對應Gmail服務器的同步地址:
image

從以上分析可以看出,Android系統的邏輯數據與應用程序一樣,存儲結構都比較簡單,且基本不採用加密,取證人員掌握簡單的取證技術均可實現手動提取和分析。
作者後期還將繼續針對Android和iOS等智能手機系統的取證進行深入探究,歡迎各位從事計算機取證工作的朋友及時批評指正,共同探討學習。


轉自 http://www.cnblogs.com/ysun/archive/2011/08/12/2136766.html

EnCase v7 簡介

Guidance 將於今年年底之前發佈EnCase v7,今日拿到了v7測試版本,下面對新功能進行簡要介紹並截圖說明。
(Version 7.0.20.13)

新用戶界面

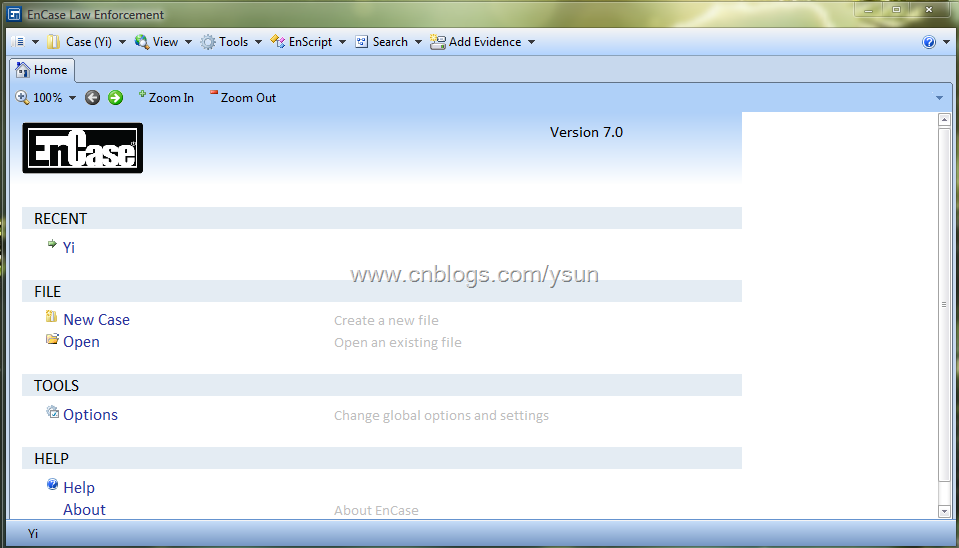
EnCase v7相對於傳統的v5、v6界面有了較大改變,一改以往的四格和多級Tab界面,而採用了單頁面多窗口的「瀏覽器式」風格,估計會讓很多v6用戶感到極不適應。

image

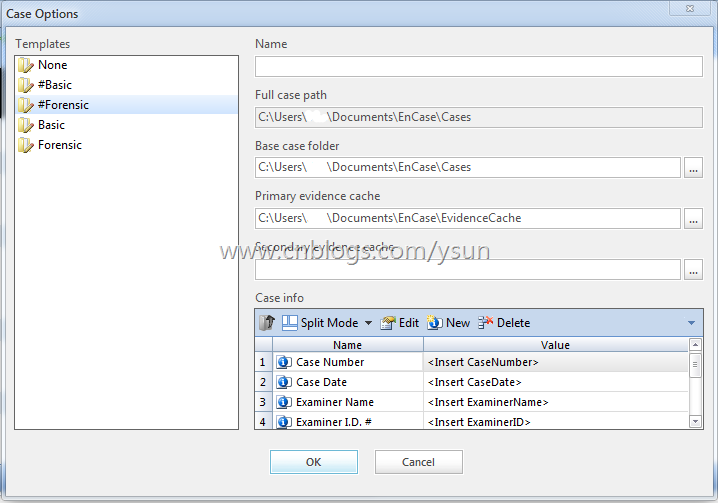
新建案例窗口,案例信息採用模板方式,調查人員可根據自己需要定製案例信息模板


image

主界面窗口

image

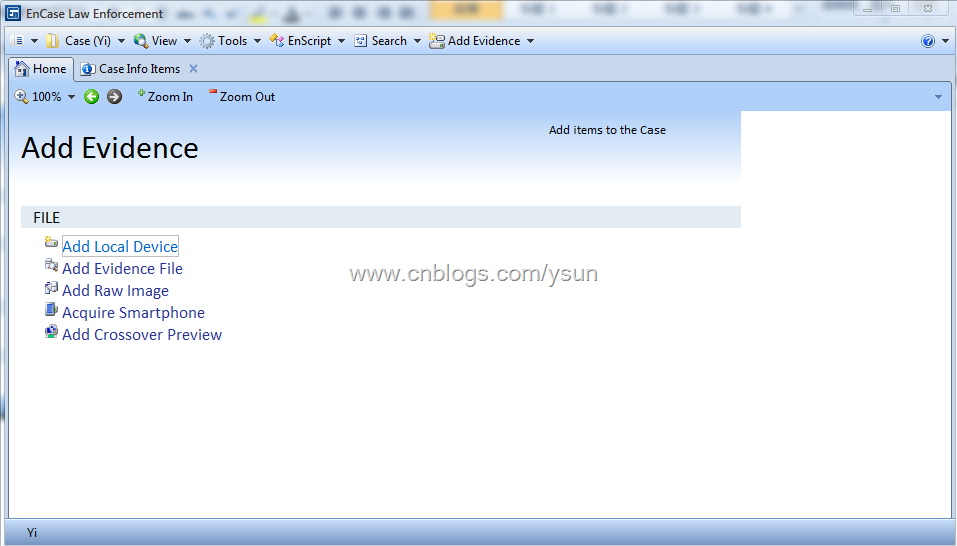
添加證據界面,新版本將Neutrino整合,可直接添加智能手機,這也是v7的一大新功能。

image

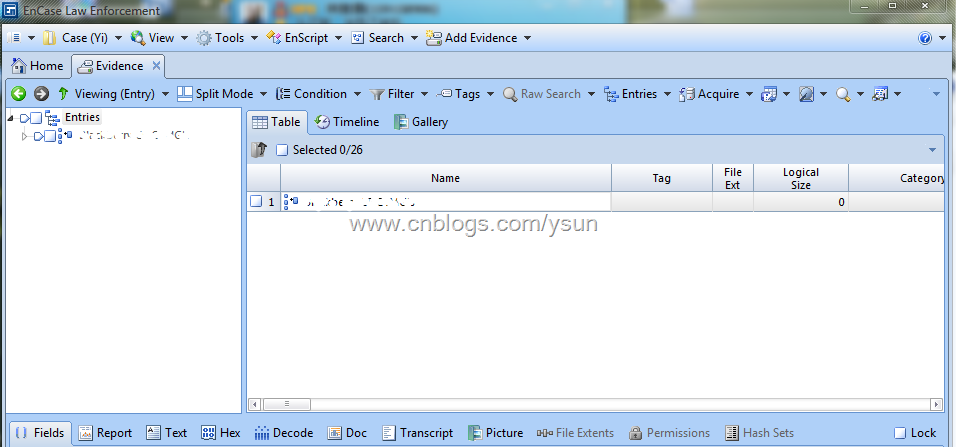
Entries部分,之前的多級標籤式結構已經變為單級標籤+前後頁面導航

新功能和改進

1. 新的案例信息界面(見上節)
2. 關聯Hash Library:新的散列庫功能允許用戶指定一個Primary和一個Secondary散列庫,方便在調查時使用多個散列集以及針對特定案件指定特定散列集。
3. 添加案例部分,界面進行了較大改進,把原來的Source樹形結構+Sessions、物理內存、進程內存三個複選框改為了嚮導式選擇,並提供DCO支持。
4. 獲取:新的證據文件界面如下,如需對加載驅動器進行獲取,則需要進行Evidence Process,這也是v7的一個新功能,將簽名校驗、哈希計算等整合在「案例處理器」中(案例處理器後述),個人認為這是EnCase 「FTK化」的標誌之一
image

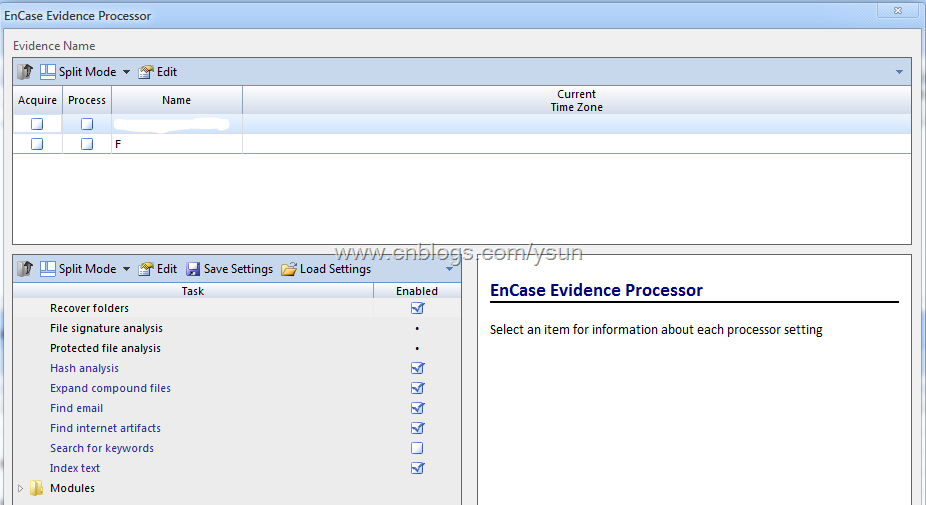
Evidence Processor

image

獲取選項,可以看到新的證據文件格式Ex01


5. 新證據文件格式Ex01:Guidance秉承了他們只要更新版本就會有大改動的「優良傳統」,此次推出了Ex01格式,官方解釋是由於E01已不能夠滿 足新版本EnCase的需求,且v7很多功能都需要新的證據文件格式配合(如Indexing),新的Ex01較E01的主要改變在於,內部數據塊全部加 密,加密方式為AES,同時,原有的壓縮選項由三項改為兩項「啟用」和「禁用」,證據文件散列自校驗支持MD5、SHA-1以及MD5+SHA-1。
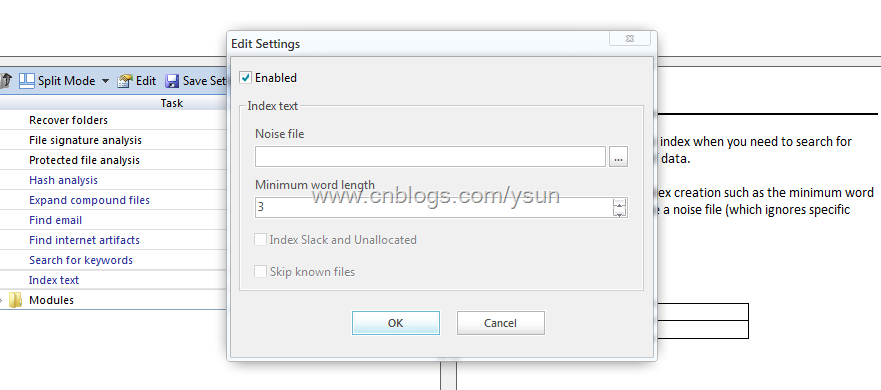
6. 證據文件處理器:Evidence Processor,新功能,整合了Recover Folders、文件簽名分析、查找加密文件(與Passware合作)、散列分析、展開符合文件、查找電子郵件、查找互聯網信息、關鍵字搜索(值得一提 的新功能,不需建立全局關鍵詞或者案例關鍵詞,直接輸入關鍵詞便可進行查找,便於初期分析)、索引(值得一提,全新的索引引擎,可以添加Noise File,並且支持在殘留區和未分配空間索引,Guidance開發經理號稱這個是他們自己開發的一項與眾不同的技術)。
    需注意的是,v7的Evidence Processor是支持多線程處理的
image

Evidence Processor 中的索引選項

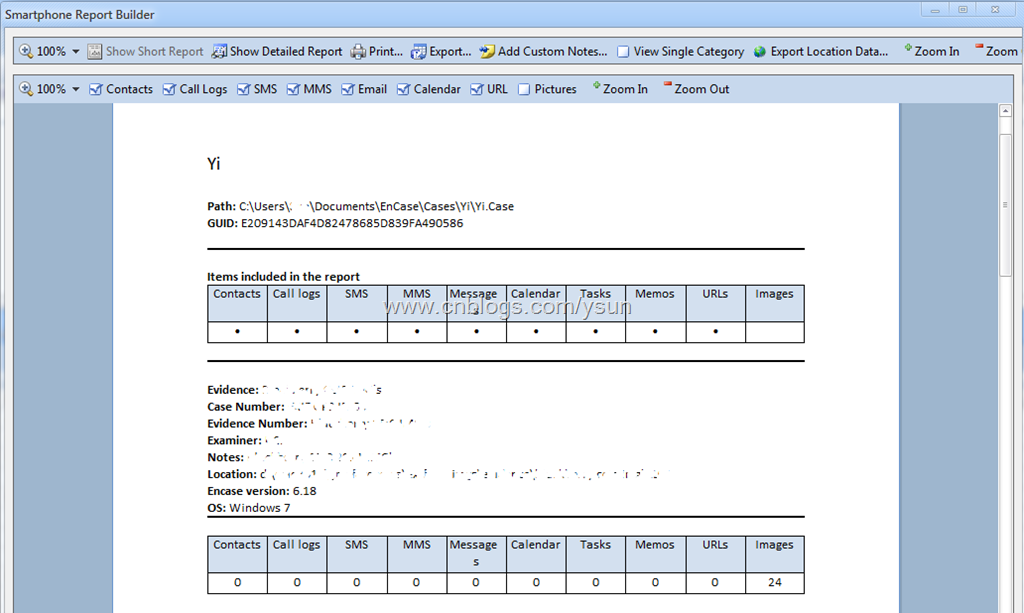
7.  智能手機支持:雖說相對於Oxygen和Paraben還具有一定差距,但畢竟EnCase不是Cell Phone Forensic軟件,所以能提供這樣的功能客觀地說已經比較難得,不過這部分在最終發佈時可能還會採取單獨的模塊銷售。
image
image

智能手機報告生成器,可自動對添加的手機證據文件生成報告,值得一提的是,可以把手機(或GPS)當中的地理位置信息或包含地理位置信息的圖片直接生成為kmz, 可使用Google Earth直接打開查看,非常方便

image

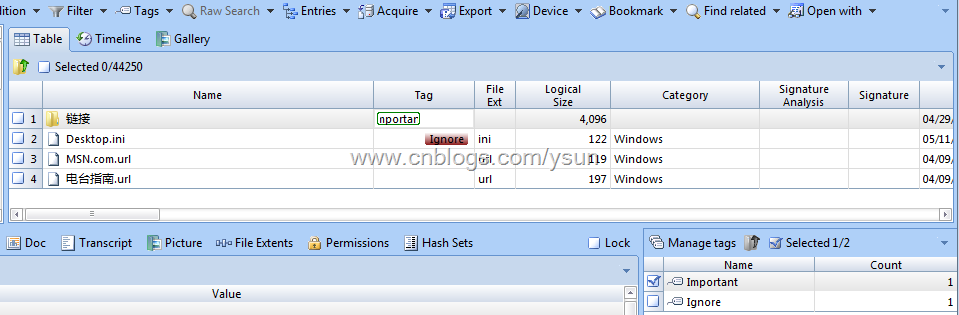
Tag,"FTK化"的又一典型標誌

8. 報告
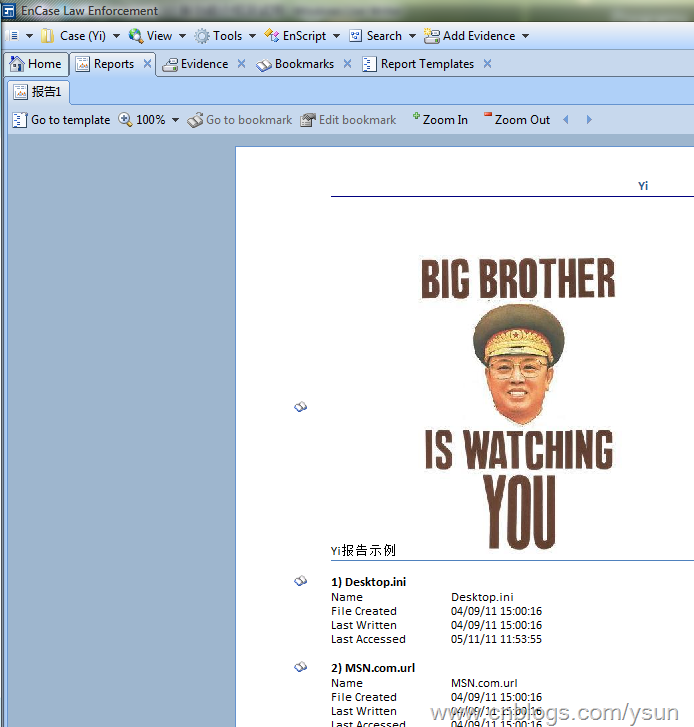
在v7中,報告功能得到了極大增強,用戶可以定製自己的模板,Guidance甚至允許用戶直接使用代碼編輯報告模板(相似於html代碼,使用非常簡單)
image

報告模板代碼編輯頁面

image

可隨時預覽的報告

9. 打包,v7允許用戶將案例、證據文件、Primary&Secondary Cache打包保存或轉移,(//這應該是EnCase轉向網絡調查方向的一個標誌),可供用戶選擇的有副本、存檔和自定義模式。
image

另外,v7中,EnScript語言也進行了一些改動,在此不再贅述。
總之,EnCase v7功能上的改動很大,後續使用感受擇日再發。


轉自 http://www.cnblogs.com/ysun/archive/2011/05/23/2054580.html